Is my bus really late every morning? How to research it with a phone log
Turn "my bus is always late" into a data project: log arrivals for a month, check open bus data, and test whether mornings are really worse.
"I'm sure my bus is late every single morning." You hear it at bus stops everywhere, and it usually stays a complaint. But it's also a claim about the world, and claims can be checked. How would you test it with data? Here's how to turn that morning frustration into a small research project you can finish in about six weeks with a phone, a free spreadsheet and public transit data.
Why five minutes at a bus stop can feel like twenty
Time stretches when nothing happens, and researchers have measured it. In a study published in 2011, Kari Watkins and colleagues watched riders arrive at bus stops in the Seattle area, recorded how long each person actually waited, and then asked how long they thought they'd waited. Riders without real-time arrival information said they had waited longer than measured. Riders who used live arrival information on their phones didn't overestimate.
So a feeling is weak evidence. "Late" has to become a number before you can test it, and that raises a real research question. Late compared with what?
There are two common answers:
Compared with the timetable. The schedule says 7:42 and the bus comes at 7:49, so it's 7 minutes late.
Compared with the planned gap between buses. If a bus should come every 8 minutes, riders care whether the next one really comes within about 8 minutes. When two buses arrive together and then nothing comes for 20 minutes, the timetable tells you little about how long people waited.
Picking a definition is a researcher's first decision, and different choices can give different answers about the same bus.
Write it down every morning, before you trust your memory
Write the time down at the stop, every morning, right away. Not later from memory, because your memory of the month is exactly what you're testing.
Researchers call this an operational definition: before collecting anything, you decide what you'll measure and how. What counts as "arrived" (the doors open at your stop)? Which clock (always your phone)? What counts as late (say, more than 3 minutes after the scheduled time)? Fix the rules first. Once you see the data, it's tempting to pick whichever definition agrees with what you already believed.
Have a question you want to investigate?
Explore our faculty-guided programs, or tell admissions what you are curious about.
Also note the time you reach the stop. That separates two things: how late the bus was, and how long you waited. A bus can be on time while you wait 12 minutes because you came early.
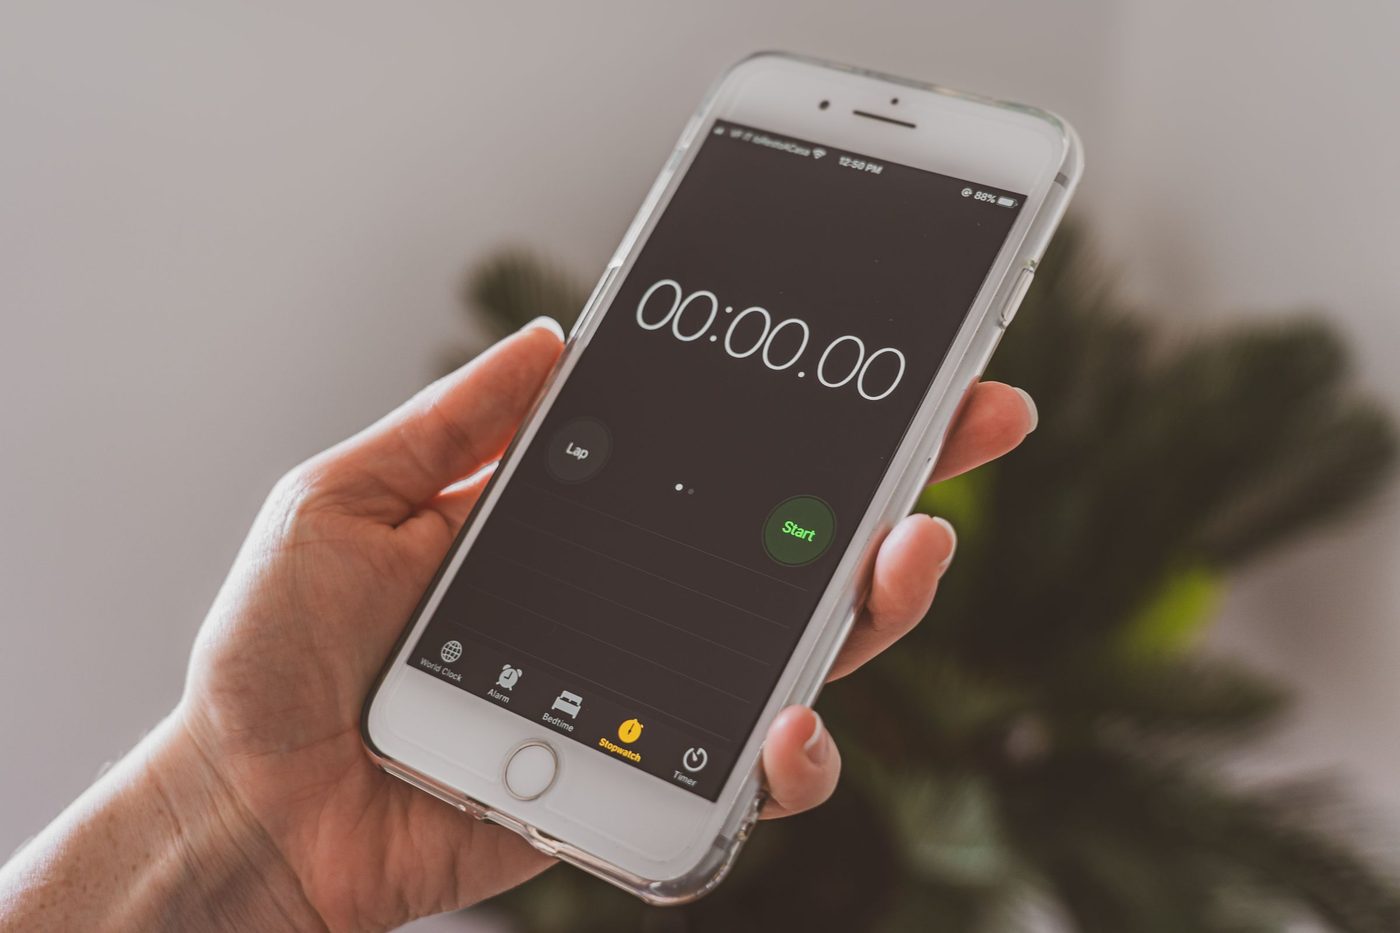
The tool for the first step is already in your pocket: the same phone clock, used the same way every morning.
New York already counts the gaps between its buses
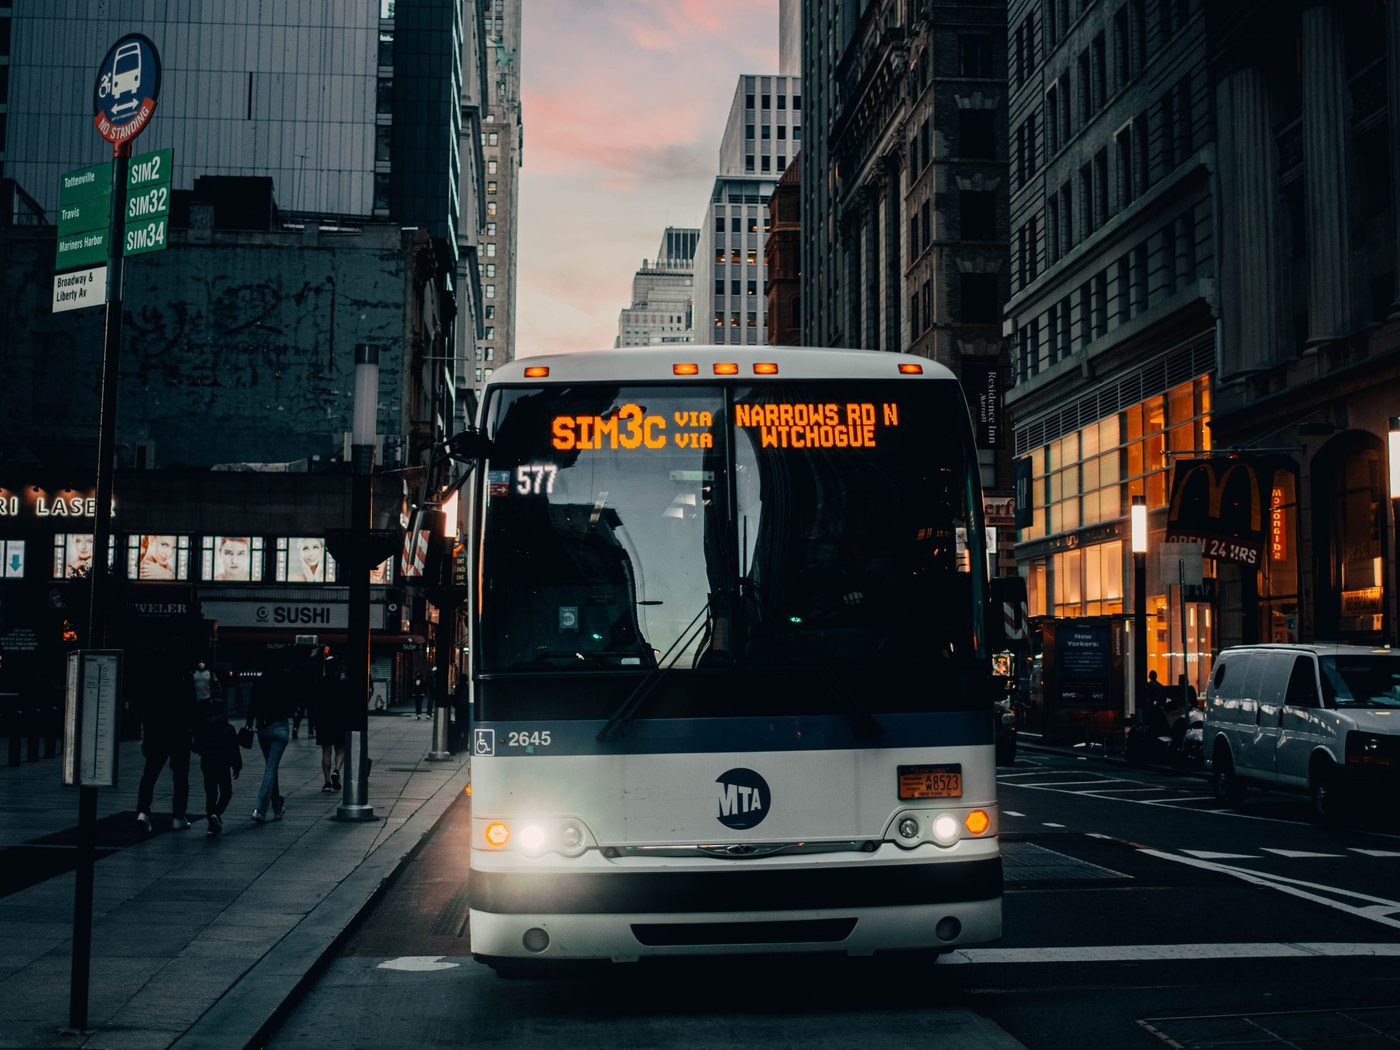
Transit agencies track buses too, and New York publishes the results. The New York State open data portal hosts the MTA Bus Wait Assessment dataset, covering New York City bus routes from January 2015 to October 2026. Each row is one route in one month, split by weekday or weekend and by peak or off-peak hours, with the route's borough, the number of trips scheduled and the number that passed.
The MTA describes Wait Assessment as a measure of "how evenly buses are spaced." Its overview document for the dataset sets the standard: a gap between two buses passes if it's no more than 3 minutes longer than the scheduled gap in the morning (7 to 9 a.m.) and afternoon (4 to 7 p.m.) peaks, and no more than 5 minutes longer at other times. The numbers come from the MTA's Bus Time tracking data.
Adding up the dataset's own columns for 2025 gives 48,760,250 passing trips out of 69,458,058 scheduled. That's 70.2%, or about 7 in 10 gaps between New York City buses meeting the MTA standard.
The MTA lists the limits itself: the measure isn't weighted by how many people wait at each stop, doesn't separate a small gap from a major delay, and isn't a true measurement of how long riders wait.
New York's open data reports, route by route and month by month, how many gaps between buses met the MTA standard.
A six-week plan that starts at your own bus stop
Step 1: Log arrivals for one month (4 to 5 weeks, 2 minutes a day)
Make a Google Sheet with one row per trip: date, weekday, morning or afternoon, scheduled time (if there's a timetable), when you reached the stop, when the bus came, and notes such as rain or an exam day. Log the ride home too. Twenty school days give you about 20 mornings to compare with 20 afternoons.
Only you and a public bus are involved, so no one else's consent is needed. If you later ask classmates or other riders how long they think they waited, that's research with people. It needs your school's approval, an IRB (ethics board) review where required, and consent from each person, including a parent's consent for anyone under 18. Don't film or photograph other riders.
Step 2: Get your city's open bus data (one or two evenings)
New York City: open the MTA Bus Wait Assessment dataset, filter it to your route and export a CSV file. It shows how often your route's gaps passed each month. It has no arrival times. The overview warns that pre-2019 numbers used an older method, so don't compare them directly with later years.
Live arrival times:MTA Bus Time shows where New York buses are right now, and its free developer API sends the same data to a program once you request a key. Many agencies share live data in a format called GTFS Realtime, which includes vehicle positions and predicted arrivals.
Korea: Seoul publishes real-time bus arrival predictions through its Bus Arrival search service on the national Public Data Portal (in Korean). It's free with a service key.
Step 3: Compare the schedule with real times (one weekend)
For each trip, subtract the scheduled time from the real arrival time. That's minutes late; a negative number means early. In Google Sheets, =(F2-D2)*1440 turns the gap between two times into minutes (format that column as Number). If your route only promises "every 10 minutes," use your own wait instead.
One log has a limit: you see one bus per trip. Measuring gaps the way the MTA does needs several buses in a row, so you'd have to watch the stop longer or save a live feed with a short script. That's an extension, not a requirement.
A countdown board turns waiting into minutes. Your log does the same, one trip at a time.
Step 4: Test whether mornings are really worse (a few hours)
Put mornings and afternoons side by side, one row per school day, skipping days where one is missing. Plot one dot per trip. Compare the medians (the middle values) first, since one terrible day can't drag a median around. Then try Google Sheets' T.TEST function. With mornings in column B and afternoons in column C, =T.TEST(B2:B21, C2:C21, 2, 1) runs a two-tailed, paired test: it matches each morning with the afternoon of the same day. T.TEST compares the averages (means) and gives a p-value: the chance of seeing a difference at least this large if mornings and afternoons were really the same. A p-value below 0.05 is usually called statistically significant. With 20 days and a few very late buses, treat it as a first hint, not proof.
Watch for unfair comparisons. In the 2025 New York data, about 65% of trips in the peak rows passed Wait Assessment, against about 72% off-peak. Rush hours look worse. But the overview gives peak hours a stricter test (3 minutes, not 5), so part of that gap may come from the ruler rather than the buses. The dataset's short column notes mention only the 3-minute rule, so read the full documentation before you compare. In your project, use one definition of late for mornings and afternoons.
The result is a one-page poster or a short paper of 4 to 6 pages: one chart, one table, a clear definition of "late" and an honest paragraph on limits, such as data from one route and one rider.
Making "always late" something you can test
Narrow it to one route, one time window, one definition and an amount of data you can actually collect.
Too big
Workable
Are buses in my city unreliable?
Over four weeks of school days, does my morning bus arrive more than 3 minutes after its scheduled time more often than my afternoon bus?
Why does waiting feel so long?
I start a stopwatch at the stop, guess my wait without looking, then check. Over 20 trips, are my guesses too long?
Which city has the best buses?
In New York's 2025 data, using only weekday off-peak rows, do routes in one borough pass Wait Assessment more often than another borough's?
The third question needs no bus ride, so it works for a student anywhere. One caution from the dataset's overview: Queens routes were redesigned in summer 2025, so compare them across that year with care.
The questions in the table all call for new numbers, which makes them original research. A literature review and a research proposal fit bus delays just as well.
In a literature review, you compare published studies to answer one question. Have studies outside Seattle also found that live arrival information stops riders overestimating their waits? Note how each measured the real wait, since a guess means little without a timed one. On Google Scholar, try "real-time information" together with "perceived wait time".
A research proposal plans a study too big to run from one stop. Do countdown screens change how long riders think they waited? You could propose that an agency add screens at a random half of the stops on several routes for a school year, while observers time riders' real waits and a short survey asks how long each wait felt. List the data (timed waits and survey answers from stops with and without screens) and the approval: an IRB review and each rider's consent, plus a parent's for anyone under 18.
Your stop, your data
Your bus was the question. Now research it.
At CRI, students research with professors in many fields, such as biology, economics, chemistry and history, and the question and the paper are their own. That paper can be original research, a literature review or a research proposal. For the details, see CRI's research programs.
Sources
Metropolitan Transportation Authority (2015 to 2026, posted monthly). MTA Bus Wait Assessment: Beginning 2015 [dataset]. New York State Open Data. Accessed November 16, 2026. link
Metropolitan Transportation Authority (2026). MTA Bus Wait Assessment Overview, version 1.1.2 [dataset documentation]. New York State Open Data. link
Metropolitan Transportation Authority. MTA Bus Wait Assessment Data Dictionary [dataset documentation]. New York State Open Data. link
Watkins, K. E., Ferris, B., Borning, A., Rutherford, G. S., & Layton, D. (2011). Where Is My Bus? Impact of mobile real-time information on the perceived and actual wait time of transit riders. Transportation Research Part A: Policy and Practice, 45(8), 839-848. link
Metropolitan Transportation Authority. MTA Bus Time. link
Metropolitan Transportation Authority. MTA Bus Time developer API. link