Does Instagram's ranked feed keep you scrolling? A high school phone study
Instagram ranks your Home feed, but its Following feed shows posts in time order. Here's how to test whether the switch changes your daily minutes.
"I can't stop scrolling, even when I'm bored." It usually comes out as a complaint about willpower. You can also read it as a question about design. The posts aren't that interesting, yet your thumb keeps moving. What is the feed doing to your attention, and is there a part of it you could measure yourself?
Your feed is ranked, not in time order
Boredom should make you put the phone down. When it doesn't, one reasonable suspect is the order of the posts, which on Instagram is chosen for you.
In a 2023 explainer signed by Adam Mosseri, Instagram said the feed uses thousands of signals, such as posts you've liked, shared, saved or commented on, and roughly a dozen predictions. The five it looks at most closely are how likely you are to spend a few seconds on a post, comment on it, like it, share it, and tap on the profile photo. Meta's own page on the feed, updated in June 2026, also lists a prediction of how likely the first post you see is to keep you spending time in your feed during that session. So the next post is picked because the system guesses it will hold you, not because it's the newest one.
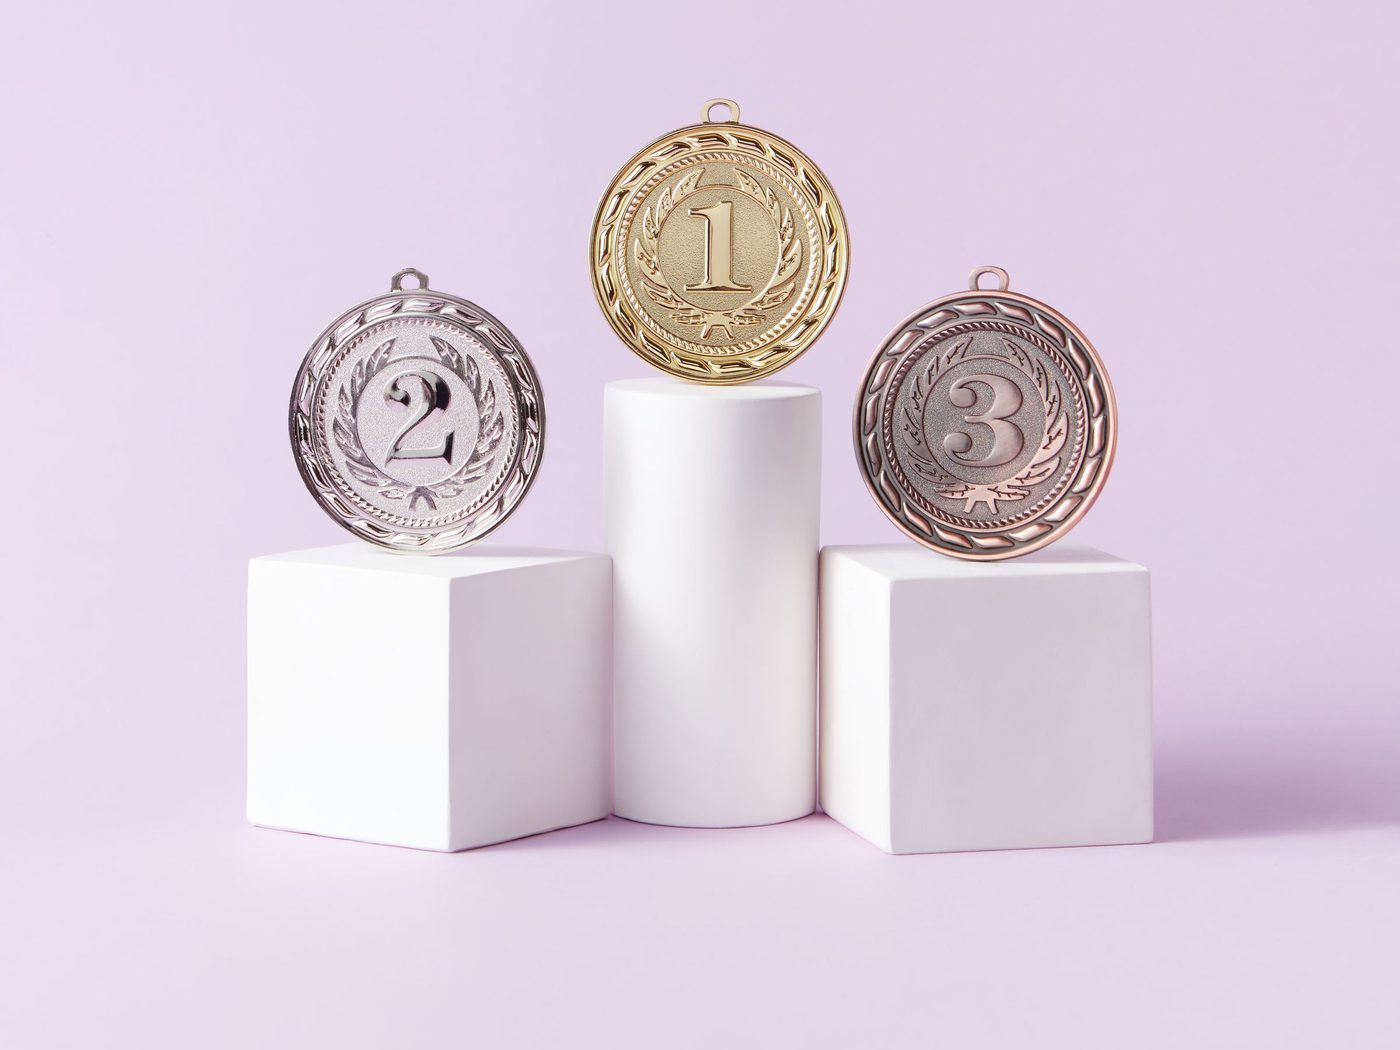
A ranked feed is ordered like a podium: by predicted interest, not by the time each post was shared.
Since March 2022, Instagram has also offered a Following view that shows posts from accounts you follow in reverse chronological order (newest first). The same Meta page says you reach it by tapping the Instagram logo on the app's home screen and choosing Following, and that it shows no recommended content. When the option launched, TechCrunch reported that it couldn't be set as the default. The app opens on the ranked feed, and you have to pick Following yourself.
That gives you two versions of the same app, which is what an experiment needs. They differ in two ways: the order of posts, and the suggested posts from accounts you don't follow, which Following leaves out. Say so in your write-up. Screen time also measures minutes, not attention. Minutes are a fair place to start, because your phone already records them.
Have a question you want to investigate?
Explore our faculty-guided programs, or tell admissions what you are curious about.
Researchers test a question like this with an experiment. It changes one thing, called the independent variable (here, which feed you use), keeps everything else as similar as possible, and measures an outcome, called the dependent variable (here, minutes in the app each day).
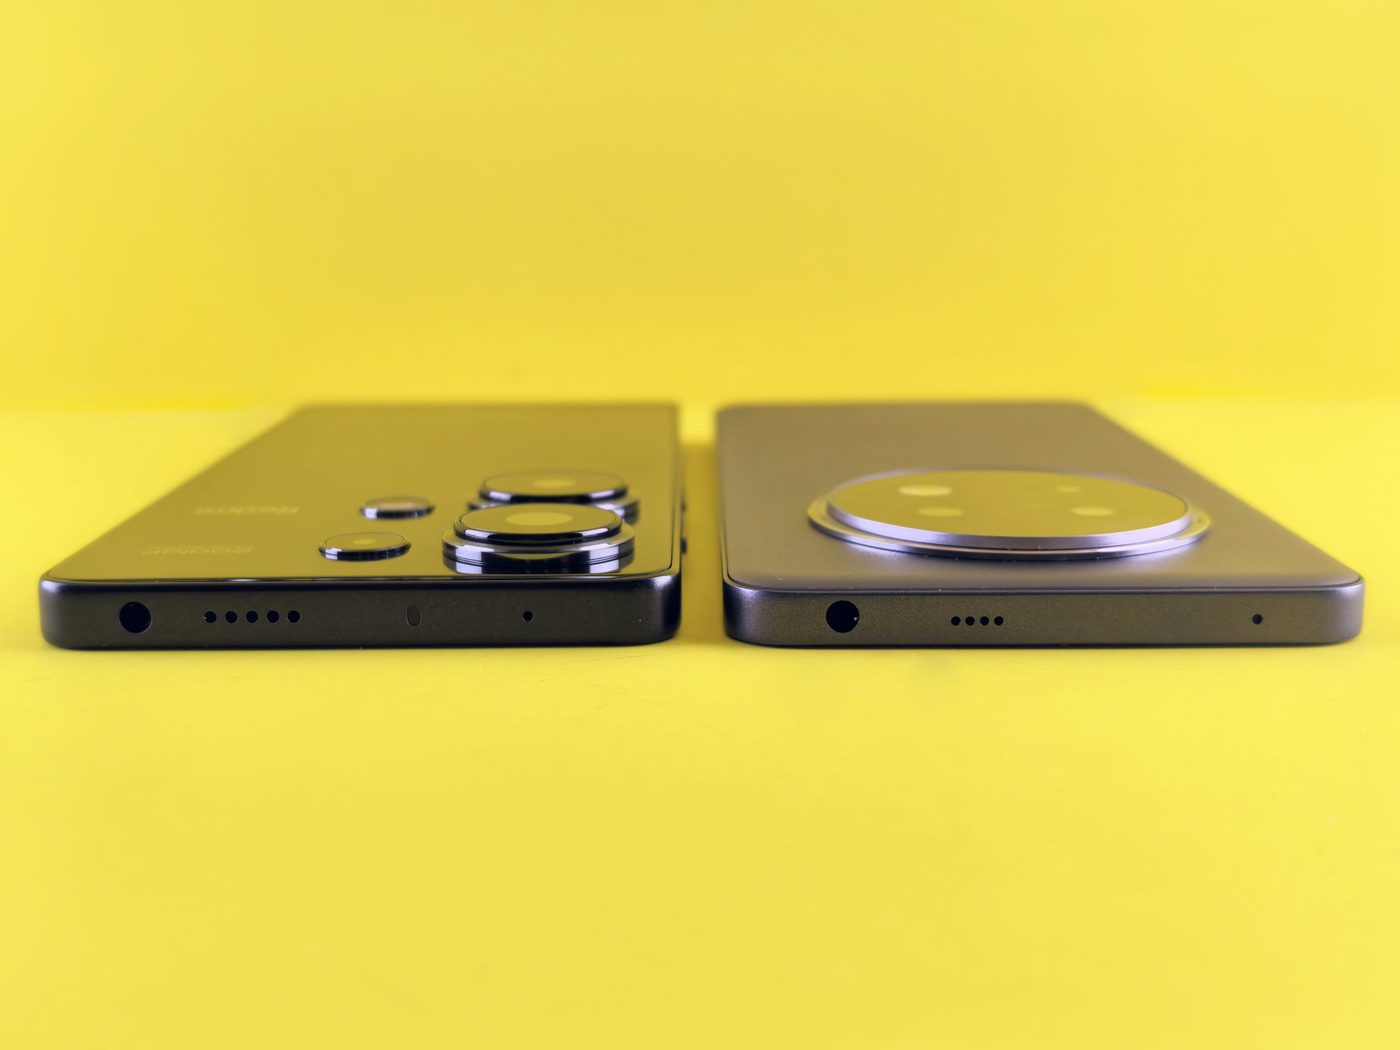
Two phones side by side stand in for the two weeks of your study: same app, same person, a different feed.
You could compare two groups of people, one on each feed, or the same people in two periods, once on each feed. The second design suits a student project, because each person is compared with themselves. Its weakness is that the two periods can differ in other ways, such as an exam week, so plan for that.
A 2023 Science study that switched feeds to time order
In July 2023, a team led by Andrew Guess (Princeton University), Neil Malhotra and Jennifer Pan (both Stanford University) published a study in Science as part of the US 2020 Facebook and Instagram Election Study, a project run by academic researchers together with Meta. For three months during the 2020 US election, they moved consenting US users from the default ranked feeds to reverse-chronological feeds and compared them with users who kept the default.
Moving users off the ranked feed substantially decreased the time they spent on Facebook and Instagram, and how active they were there. Time order didn't make everything better, though. On both platforms, those users saw more political content and more content from untrustworthy sources. Over the three months, the change didn't significantly shift their political attitudes or knowledge.
Keep its limits in mind: it studied US users during an unusual election season, and it measured time on the platforms, not attention. It can't tell you what happens to students at your school today, and that gap is where your own study fits.
A two-week test on your own phone
If you plan to enter a science fair that follows ISEF rules, get approval before Step 1: those rules count even a study of yourself as research with human participants, and an IRB (a board that reviews studies with people) must approve it first.
Step 1: Record a normal week (7 days, about 2 minutes a day). Turn on Screen Time on an iPhone (Settings, then Screen Time) or Digital Wellbeing on Android (Settings, then Digital Wellbeing, then tap the chart; menu names vary by phone). Both show minutes per app. iPhone also counts pickups, and Android counts how often you unlock the phone and open apps. Make a Google Sheet with one row per day and columns for Instagram minutes, total phone minutes, YouTube and TikTok minutes, and pickups or opens. Each morning, copy yesterday's totals, so late-night scrolling counts. iPhone lets you swipe back to past days; if your Android phone shows only today, copy the numbers just before you sleep instead. Use Instagram as you normally would.
Other apps matter: if your Instagram minutes drop later, the time may simply move elsewhere, and total phone time will show it.
Step 2: Open the Following feed every time (7 days). Since the app opens on the ranked feed, switch each time: tap the Instagram logo, then Following. Check your version of the app first. Meta notes that its options "may not be available to everyone," and Instagram's 2023 explainer said Following showed the last 30 days of posts, so notice whether you run out of new posts. Instagram ranks Reels and Explore separately, and your phone counts the whole app, so decide in advance whether you'll use Reels as usual in both weeks. Keep a tally of the times you forgot to switch.
Step 3: Add classmates, with school approval (a few weeks for approval, then 2 to 3 weeks of data). One person's two weeks is a case study; 10 to 20 people make a small dataset. Ask a teacher to help with school approval first. Under ISEF rules, the IRB must approve before you recruit anyone, and participants under 18 need their own agreement plus written permission from a parent. Show parents the form when you ask. Collect only numbers, through a Google Form with code names, not real names, account names or screenshots. Anyone can stop at any time. To handle the exam-week problem, flip a coin for each person: heads start with Following, tails with the ranked feed.
Step 4: Compare minutes, ranked vs. Following (an afternoon, then a week to write). For each person, find the average daily Instagram minutes in each week, then the difference. A chart with one pair of bars per person shows the pattern. To check whether the difference could be chance, Google Sheets has a paired t-test: =T.TEST(ranked_range, following_range, 2, 1), where 2 means a two-tailed test and the final 1 means paired data (how T.TEST works). With 10 to 20 people, call it a pilot study. For background on smartphone use in Korea, the Internet Addiction Prevention Center (also called Smart Shim Center), run by Korea's National Information Society Agency (NIA), offers the 2024 and 2025 national Smartphone Overdependence Survey reports as free PDFs (in Korean), with statistical tables you can cite in your introduction.
Your own chart needs only one pair of bars per person: the ranked week next to the Following week.
The finished product is a one-page poster (question, method, chart, limits) or a short paper of four to six pages.
Picking one number to track
"Social media" is a topic. In a hands-on test, a research question names who, what you change, and what you measure:
Too big
Workable
Is the Instagram algorithm making teenagers addicted?
Do 10 to 20 students at my school spend fewer minutes a day on Instagram in a Following week than in a ranked week?
Does social media ruin attention?
When students use the Following feed, do the minutes they save on Instagram show up on YouTube or TikTok instead?
Why do people keep swiping when they're bored?
Do students open Instagram, or pick up their phones, fewer times a day in the Following week?
The questions on the left are too big for one study. The ones on the right name one change and one number, and you can report the result after two weeks, whichever way it comes out.
Logging your own minutes is one kind of research, called original research. This topic also fits a literature review or a research proposal.
A literature review compares studies that already exist. The Science study found a time-ordered feed cut time on both platforms. How far do other feed experiments back that up, and did they count minutes from phone logs, platform records or people's own estimates? Search Google Scholar for "chronological feed" and PubMed for "adolescent screen time".
A research proposal designs a study too big for one school. Would a semester on the Following feed change students' sleep, not only their minutes? The design might assign a few hundred students at several schools at random to one feed or the other, collecting screen-time logs and a sleep diary each morning. Then spell out the approvals: the school's permission, an IRB review, and a parent's permission plus the student's own agreement for anyone under 18.
A small result still counts
If minutes drop in your two-week test, you have evidence that the feed you use matters for your group. If they don't, that's worth reporting too, and your limits section can say why.
Your scrolling was the question. Now research it.
If the part that interests you most is the default, the ranked feed the app opens on, you're asking how choices are designed. David McMillon, Assistant Professor of Economics at Emory University, teaches The Architecture of Choice: Behavioral Economics, Cognitive Bias, and Nudge Theory in CRI's Winter Online Research Program: online, December 19 to 30, 2026, up to 5 students, applications close December 15. Each student there writes their own paper, and original research, literature reviews and research proposals are all welcome.
Sources
Guess, A. M., Malhotra, N., Pan, J., et al. (2023). How do social media feed algorithms affect attitudes and behavior in an election campaign? Science, 381(6656), 398-404. doi:10.1126/science.abp9364
NYU Center for Social Media, AI, and Politics (2023). How do social media feed algorithms affect attitudes and behavior in an election campaign? (research summary). link
NYU Center for Social Media, AI, and Politics (2023). First four papers from US 2020 Facebook & Instagram Research Election Study published in Science and Nature. link
Mosseri, A. (2023). Instagram ranking explained. Instagram. link
Meta (2026, updated June 29). Instagram Feed AI system. Meta Transparency Center. link
Meta (2022). Two new ways to control your Instagram feed. Meta Newsroom. link
Perez, S. (2022). Instagram launches chronological and 'favorites' feeds for all users, but they can't be the default. TechCrunch. link
Apple. Set up Screen Time for yourself on iPhone. iPhone User Guide. link
Google. Manage how you spend time on your Android phone with Digital Wellbeing. Android Help. link
Internet Addiction Prevention Center (Smart Shim Center), National Information Society Agency (2026). Smartphone Overdependence Survey reports, 2024 and 2025 (in Korean). link