How to read journal rankings: JIF, JCI, CiteScore, SJR and SNIP
Five metrics dominate journal rankings, and each measures something different. Learn how they are calculated, where to find them and how to use them to choose where to submit.
Once a paper is written, a new question takes over: where should it be published? The journal you choose shapes who reads the work, how it is judged, how often it is cited and how much credibility it lends you as a researcher. To compare journals, researchers lean on five metrics in particular: the Journal Impact Factor (JIF), the Journal Citation Indicator (JCI), CiteScore, the SCImago Journal Rank (SJR) and Source Normalized Impact per Paper (SNIP).
None of them simply means "higher is better." Each has its own formula, time window and idea of what should count, and the right one depends on your field.
What a journal metric measures
Almost every journal metric starts from citations: how often the papers a journal published during a set period were cited by other papers, expressed as an average. That number does not measure quality directly. What it reveals, indirectly, is how often a journal's work is cited in its field and how much other researchers trust it.
Metrics take one of two approaches:
Absolute indicators rank journals by citation counts. More citations mean a higher score, which tends to favor journals in popular, heavily cited fields. JIF and CiteScore work this way.
Field-normalized indicators correct for the fact that citation habits differ between disciplines. They compare each journal with a baseline average set at 1.0 (the field average for JCI and SNIP, the average across all journals for SJR), so journals in low-citation fields such as the humanities and social sciences get a fair comparison. JCI, SJR and SNIP work this way.
Why does that correction matter? A physics paper can collect many citations within a year or two of publication, while a history paper may take a decade to be widely cited. Rank journals on raw citations alone and the high-citation fields win every time. A field-normalized score instead tells you how far above or below its field's average a journal sits: a JCI of 1.5 means its papers are cited about 50% more than the field average.
How to read a ranking
Treat a ranking as a clue to a journal's influence, not proof of its quality. A high score does not make every paper in the journal excellent, and a low one does not make a study less valuable. Part 6 of our paper-writing guide, on the , explains how to judge an individual paper on its own merits: its citation count, its design and its author's track record.
Have a question you want to investigate?
Explore our faculty-guided programs, or tell admissions what you are curious about.
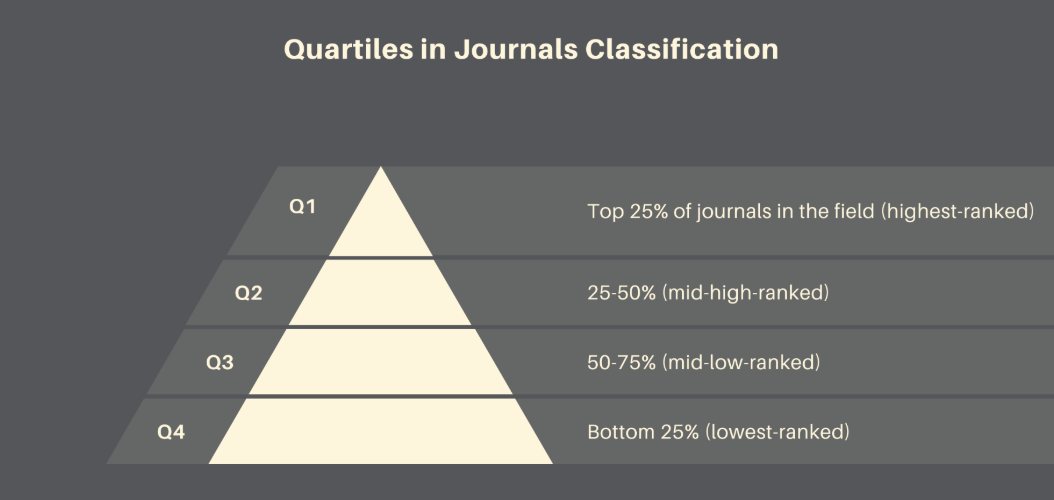
Rankings are often reported in quartiles, which place a journal within its subject category. Q1 is the top 25% of journals in the field, Q2 the next quarter, Q3 the band from 50% to 75%, and Q4 the bottom 25%.
Journal quartiles: Q1 is the top 25% of journals in a field, Q4 the bottom 25%.
Clarivate's metrics: JIF and JCI
Clarivate, the company behind Web of Science, publishes JIF and JCI every year in its Journal Citation Reports (JCR). They are usually the first numbers to check when you plan where to submit.
Journal Impact Factor (JIF)
JIF is the most widely used journal metric in the world. It averages the citations that a journal's papers from the previous two years receive in a given year. The 2024 JIF, for instance, counts citations made in 2024 to papers published in 2022 and 2023:
JIF = citations in a given year to papers from the two previous years ÷ papers published in those two years
Until recently, only journals in the Science Citation Index Expanded (SCIE) and the Social Sciences Citation Index (SSCI) received a JIF. Since 2023 it has also covered the Arts & Humanities Citation Index (AHCI) and the Emerging Sources Citation Index (ESCI), so humanities and arts journals now have one too.
JIF's strength is speed: it captures short-term citation performance quickly. Its weakness is that same two-year window, too short to reflect how citations build up in some fields. It is most informative where research moves fast, as in the life sciences and engineering. In the humanities and social sciences, read it alongside a complementary metric such as JCI.
Journal Citation Indicator (JCI)
JCI draws on three years of citation data and normalizes it against the journal's field, where the average is 1.0. That makes it fair to low-citation disciplines and lets you compare relative influence across fields. Where JIF captures short-term citations, JCI also reflects longer-term influence and a journal's standing in its field.
The two numbers can tell different stories. A journal with a JIF of 2.5 and a JCI of 1.8 has considerably more influence than the average in its field. A journal with a high JIF but a JCI of 0.9 may sit below average in its own field. A few practical rules follow:
JIF suits fast-cited fields driven by the latest research; JCI suits fields where long-term citation matters, such as the humanities, social sciences and arts.
Before you submit, look the journal up in JCR and check both its subject category and its percentile rank within that category.
A JCI of 1.0 or higher means the journal is at or above its field's average.
When comparing several journals, weigh JIF and JCI together. JIF shows the volume of a journal's influence; JCI shows where it stands in its field.
Scopus metrics: CiteScore, SJR and SNIP
Clarivate's metrics, built on Web of Science, are the traditional standard. Elsevier's Scopus covers a much broader range of journals, and the three metrics built on its data go beyond raw citation counts to capture the quality of citations and the character of each field. Our guide to Web of Science and Scopus, also on the CRI blog, explains how each database selects and evaluates the journals it covers.
CiteScore
CiteScore divides the citations a journal's papers receive over a four-year window by the number of papers it published in those same four years.
CiteScore = citations over four years ÷ papers published in the same four years
Because the window also includes citations made in a paper's year of publication, CiteScore takes a broader, longer view than JIF. Anyone can check it free on Scopus, and CiteScore Tracker shows how the number changes month by month. It moves more gradually than JIF and holds up reasonably well in the humanities and social sciences, which makes it useful in fields with long citation cycles or whenever you want to judge sustained influence.
SJR (SCImago Journal Rank)
SJR weighs where citations come from, not just how many there are: a citation from a highly influential journal counts for more than one from a lesser journal. Scores are normalized so that the average across the world's journals is 1, and anything above 1 signals above-average influence.
SJR is free on the SCImago Journal & Country Rank website, searchable by journal title, subject area or country, with each journal's quartile (Q1 to Q4) shown alongside. Turn to it when the quality of a journal's citations matters more to you than their quantity.
SNIP (Source Normalized Impact per Paper)
SNIP was designed to correct for differences in citation culture between fields. It sets each field's average citation rate at 1 and measures the journal against it:
SNIP = the journal's citation rate ÷ the average citation rate in its field
A SNIP of 1.3 means the journal is cited 30% more often than the field average. SNIP is free on the CWTS Journal Indicators website, which uses Scopus data and can be searched by title or ISSN. Like JCI, it picks up field-specific patterns that JIF or CiteScore alone would miss, and it is best for judging where a journal stands within your own research area rather than for comparing disciplines.
The five metrics side by side
Metric
Provider and where to find it
Citation window
Type
Best used for
JIF
Clarivate, Journal Citation Reports
2 years
Absolute
Short-term citation impact in fast-moving fields
JCI
Clarivate, Journal Citation Reports
3 years
Field-normalized (1.0 = field average)
Standing within a field, including low-citation fields
CiteScore
Elsevier, Scopus (free)
4 years
Absolute
A broad, steady view of citation volume
SJR
SCImago Journal & Country Rank (free)
3 years
Normalized (1 = average across all journals), weighted by the citing journal's influence
The quality of citations, not just their number
SNIP
CWTS Journal Indicators (free)
3 years
Field-normalized (1 = field average)
Relative influence within your own field
In short, JIF and JCI show how much a journal is cited, while CiteScore, SJR and SNIP show how it is cited.
One search, every metric: S2Journal
JCR and Scopus both help you judge whether a journal can be trusted, but each requires its own login and search, and the metrics have to be looked up one at a time. S2Journal, a Korean journal-information service, puts them in one place. It combines data on international and Korean journals from Clarivate's JCR, Scopus, Google Scholar and the Korea Citation Index (KCI), and it is used by individual researchers, university libraries and institutional evaluators alike.
Every metric in one search. Enter a title or ISSN to see JIF, JCI, CiteScore, SJR, SNIP and KCI listing status at once, with the journal's subject category, country, publisher and open-access status.
Rankings within the field. Percentile or quartile data show where a journal sits in its category.
Excel export. Save results as a spreadsheet to compare candidates or bring a shortlist to a lab meeting.
Korean and international journals side by side. Seeing KCI next to SCIE and Scopus helps researchers in Korea decide whether a topic suits a domestic or an international journal.
Say you are preparing a paper in environmental economics and look up Ecological Economics. One search brings up all five metrics alongside its SJR quartile (Q1), publisher (Elsevier), country of publication (the Netherlands) and the fact that it is not listed in KCI, so you can see at a glance that it ranks in the top quarter of its field.
Fit matters more than a score
Publishing a paper is more than making results public. It decides which scholarly community will read the work and whether that community will trust it. Understanding journal rankings is not about memorizing scores; it is part of preparing to communicate your research well.
Each of these metrics shows, from a different angle, how widely a journal is cited and how much it is trusted. None of them can replace the value of the research itself. Metrics point the way, but the researcher still has to walk it. A good paper finds its home by matching its topic to the right journal, not by chasing the highest score.
CRI helps students learn not only how to write a paper well but how to publish it responsibly: choosing the right journal, understanding what its metrics mean, and sharing their results in a way others can trust. That is the first real step in becoming a researcher.
In the 1-on-1 Advanced Research Program, students spend several months writing an individual paper with a faculty mentor. Once the manuscript takes shape, picking a target journal becomes part of preparing it for submission, and CRI supports each student through that step.