Why did the stream change color? How researchers trace pollution upstream
Rusty, green or brown water has a cause somewhere along the channel. Narrow down where the change begins with free maps and public water-quality data.
"The stream behind my school changed color last summer." People notice it on the walk home: the water looks rusty for a few weeks, or turns green, or runs brown after a storm. Someone guesses at a cause, and that's where it ends.
Scientists ask one more question: where did the change come from? The first steps to answering it use free maps and public data that anyone can open.
What a stream's color can and can't tell you
The U.S. Geological Survey (USGS) notes that natural water always has some color. Soil runoff makes water yellow, red, brown or gray. Water rich in algae usually looks green. Tannins, dissolved substances from leaves, roots and plant remains, give water a yellow or brown tint that filtering probably would not remove.
Orange often has a natural cause too. The University of Connecticut's environmental health and safety office says orange slime in streams is often iron-oxidizing bacteria, which oxidize iron dissolved in groundwater in a reaction similar to rusting. The office says they aren't harmful and show that the stream is partly fed by groundwater. But mine drainage can turn water orange as well, as the Gold King example below shows.
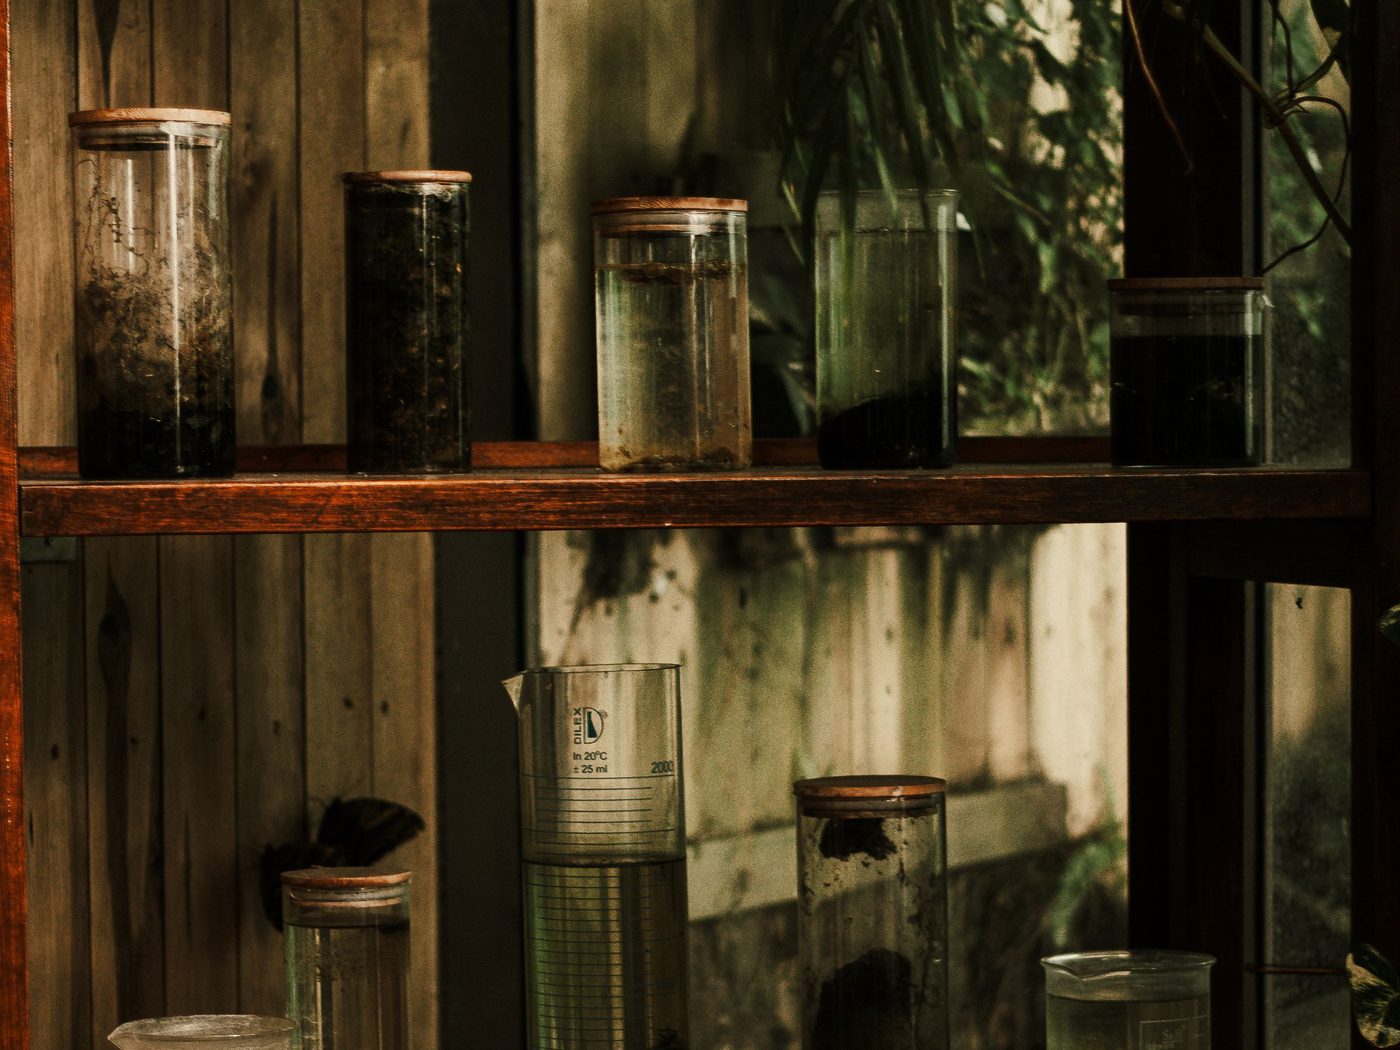
Water can look clear, green, brown or dark depending on what is in it, which is why color starts a question instead of answering it.
What matters is what's in the water now that wasn't there before, and where it got in. Water flows one way, so every change has a location along the channel. In that sense, the water carries its own history.
Walk upstream and find where it changes
One way to find a source is to compare the water upstream and downstream. The volunteer stream monitoring manual of the U.S. Environmental Protection Agency (EPA) suggests it for checking whether a suspected source has an impact.
First, pick a measurement that responds to what you suspect, such as conductivity. It measures how easily water carries an electric current, and it rises with dissolved salts and metals such as iron and aluminum. EPA notes that each stream tends to stay within a fairly steady range, so a significant change can point to a discharge.
Have a question you want to investigate?
Explore our faculty-guided programs, or tell admissions what you are curious about.
Next, measure above an inflow, such as a side creek or a drain pipe, and below it. If the reading changes only below, that inflow becomes a suspect. Repeat at the next inflow upstream until you find the stretch where the change begins. EPA's manual also asks whether each site is far enough below drains and side streams. Two waters can flow side by side for a while before they mix.
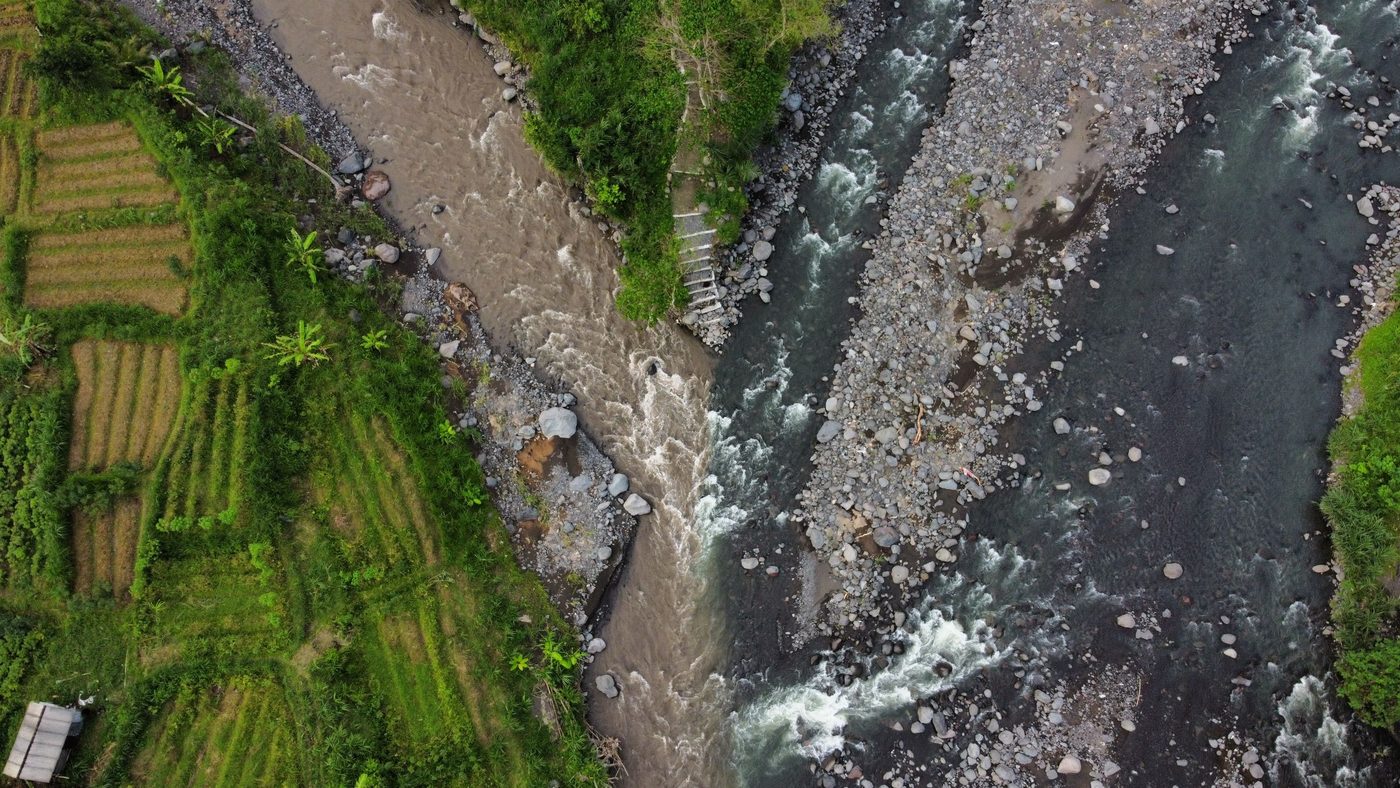
Where two channels meet, the waters can stay separate for a while, so a reading below an inflow has to be taken far enough downstream.
Two cautions apply. One reading proves little, because rain, season and time of day all shift water chemistry, so researchers repeat measurements. And a change doesn't always mean a pipe: groundwater seeping in can change readings too.
What the Gold King Mine spill showed
On August 5, 2015, an EPA field investigation at the Gold King Mine near Silverton, Colorado, accidentally triggered the release of about 3 million gallons of acidic mine water into Cement Creek, a tributary of the Animas River. For days a bright yellow plume moved downstream, and some news reports called the Animas orange. EPA later explained the color: iron and aluminum from the mine water reacted with the river water.
The source was known on day one, because EPA's own work had caused the release. The harder question was where the metals went. In a January 2017 report, EPA scientists estimated that about 490,000 kg (close to 540 tons) of metals, mostly iron and aluminum, entered the Animas during the nine-hour release. Only about 1 percent came from inside the mine; the other 99 percent was scoured from a waste pile on the hillside and the bed of Cement Creek. The plume traveled about 550 km (342 miles) in nine days, from Colorado through New Mexico to Lake Powell in Utah. The team analyzed 1,758 water samples and 963 sediment samples from 294 sites, collected by EPA, states and tribes over the following year.
One limit is common in pollution research: the river already carried metals from hundreds of old and abandoned mines in the region. EPA notes that the spill's deposits, though bright yellow, held metal concentrations on average similar to those already stored in the riverbed. Separating one event from a long history of mining pollution is hard, even with thousands of samples.
Tracing your own stream with free maps and data
The four steps below use free tools and public data. The whole project takes four to six weeks of part-time work, including the write-up.
1. Trace your stream on free maps (1 to 2 hours). Open Google Earth in your browser and follow your stream upstream in satellite view. Its Measure tool lets you click points along the channel and read off the length. This works for streams in Korea too. In the US, USGS StreamStats outlines the land area that drains to a point you pick on a stream, though what it offers varies by state.
2. List everything that drains in (an afternoon, plus one walk). Mark every side creek, pipe, ditch, farm and factory along your stretch. EPA's watershed survey guide suggests starting with maps and land use, then checking which industries hold permits to discharge into the stream. In the US, EPA's How's My Waterway shows permitted dischargers for a location. Then check your map on a walk along public paths and bridges with a friend or an adult. Don't wade in or touch water that looks or smells like chemical or mine waste. Tell an adult and report it instead.
3. Download public water-quality data (2 to 4 hours). In the US, the Water Quality Portal combines publicly available water-quality data from USGS, EPA and more than 400 state, federal, tribal and local agencies. You can search by county or by a radius around a point, choose measurements such as pH or specific conductance (the portal's name for conductivity), and download a CSV or Excel file. For USGS data added after March 11, 2024, use the portal's beta version. In Korea, the Water Environment Information System, from the National Institute of Environmental Research, maps monitoring sites on rivers and lakes and lets you download readings such as BOD (how much oxygen microbes use to break down organic matter), total nitrogen, total phosphorus and dissolved oxygen as CSV files. The site is in Korean.
4. Compare upstream and downstream readings (1 to 2 weeks of evenings). In a free spreadsheet such as Google Sheets, plot one measurement against distance downstream and draw a vertical line wherever an inflow from step 2 joins. Compare readings from the same dates where you can. A clear jump or drop just after one of those lines is a lead worth following.
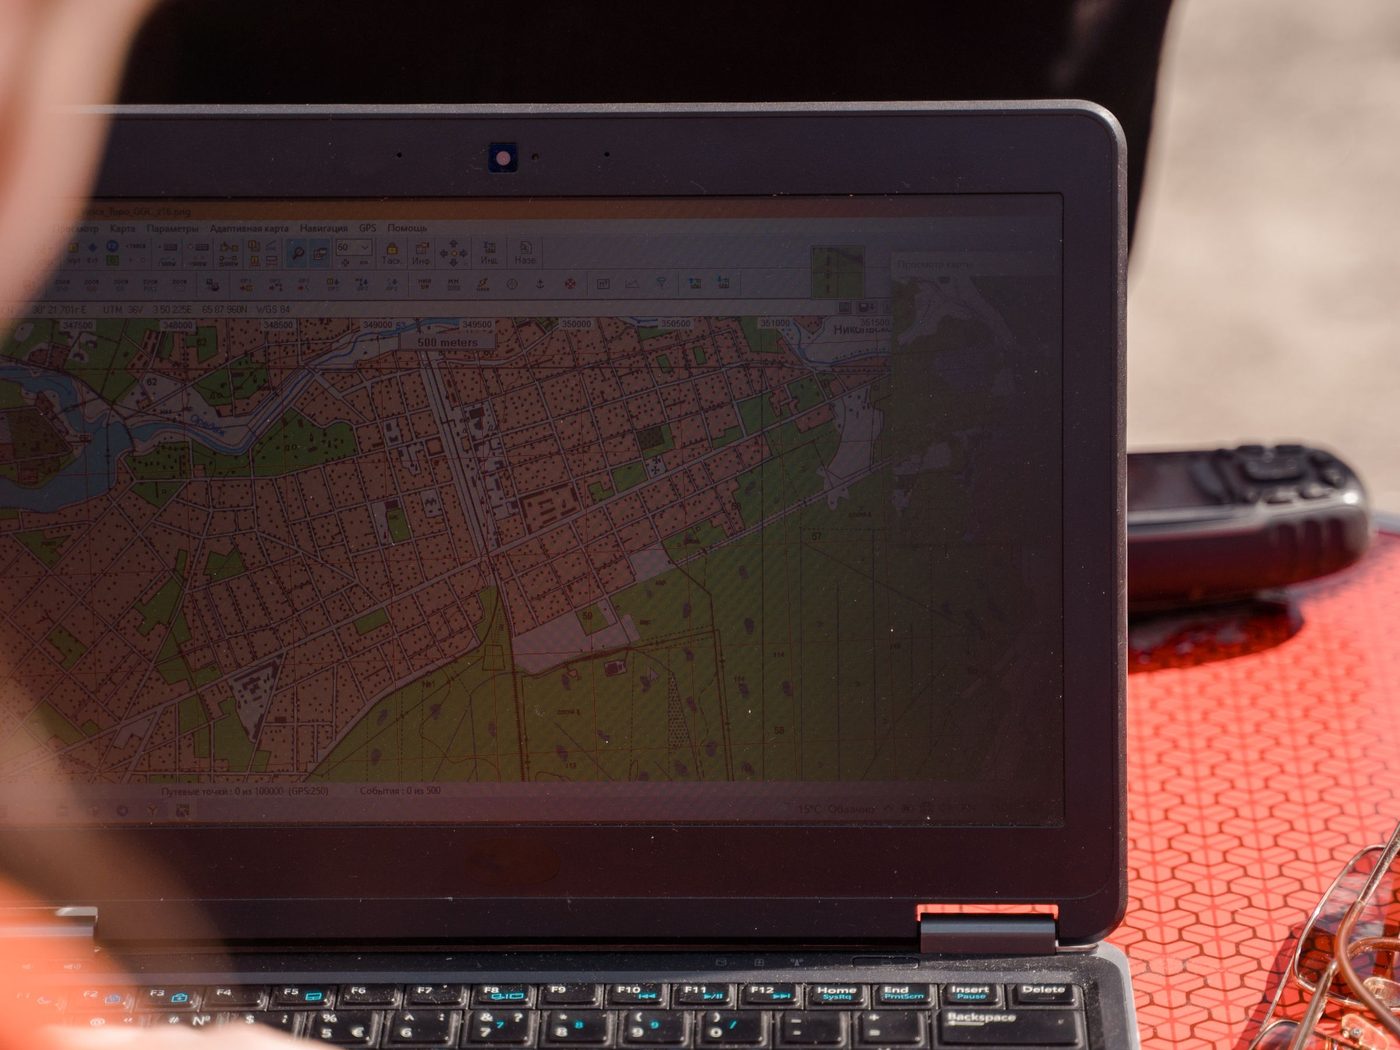
Much of this project happens on a computer: mapping the stream, marking inflows and lining up monitoring sites.
Scale is the main limit. Public monitoring sites are often kilometers apart and sampled weekly or monthly, and a small stream may have no site at all, so you may need to study the river it flows into. You can narrow down where a change happens between two sites, but you can't prove which pipe caused it. To add your own readings on a small stream, a low-cost pH color kit or a conductivity meter will do. Get your school's approval for the fieldwork first and follow EPA's safety rules: never sample alone, never wade in swift or high water, wear gloves where you suspect pollution, and wash your hands afterward.
You'll finish with a map of numbered inflows and sites, a chart of readings by distance, and a poster or a 6 to 10 page paper on where the change appears and what might explain it.
Stream questions with one measurement each
Here are three, each next to a version that's too big:
Too big
Workable
Is the river in my city polluted?
Between the monitoring sites just above and below my city, how much does total phosphorus change, and is the change larger in the rainy season?
What turned the stream behind my school orange?
Over six visits, do pH and conductivity differ between the orange stretch of my stream and a stretch 200 m upstream, and does the orange begin at a groundwater seep?
How did the Gold King spill damage the Animas River?
In EPA's posted sampling data from August 2015, how did dissolved iron change from the upper sites to the lower sites as the plume moved downstream?
You can answer each workable version within a few weeks. If your answer turns out to be "we could not tell," that's still a finding, as long as you can explain why.
Two other kinds of stream paper
The inflow map and the chart of readings give you a paper built on monitoring data. A literature review builds one from published studies, and a research proposal from a study you plan in full but don't run. A review might ask, for example, how researchers tell a natural iron seep from mine drainage when both turn a stream orange, and which measurements they rely on. Look in Google Scholar and the USGS Publications Warehouse, where many U.S. Geological Survey studies are free to download. A proposal could plan the bigger version: a year of conductivity loggers above and below every inflow, with monthly lab tests for dissolved iron and aluminum. Include the question, the method, the data (logger readings, lab results, rainfall records) and who has to agree: the agency that manages the stream and the landowners, plus an ethics board if you also interview neighbors about when the color first appeared.
From a walk home to a dataset
Research like this starts with a map and the stream you already walk past. Your stream was the question. Now research it.
Through CRI, students research with professors in many fields, such as biology, economics, chemistry and history, and turn a question of their own into a paper they write themselves, be it original research, a literature review or a research proposal. CRI's research programs explain how it works.
Sources
U.S. Environmental Protection Agency (n.d.). Emergency Response to August 2015 Release from Gold King Mine. US EPA. link
U.S. Environmental Protection Agency, Office of Research and Development (2017). Analysis of the Transport and Fate of Metals Released from the Gold King Mine in the Animas and San Juan Rivers: Executive Summary (EPA/600/R-16/296). US EPA. link
U.S. Environmental Protection Agency (n.d.). Emergency Response Monitoring Data from the Gold King Mine Incident. US EPA. link
Wikipedia contributors (n.d.). 2015 Gold King Mine waste water spill. Wikipedia. link
U.S. Geological Survey Water Science School (n.d.). Water Color. USGS. link
University of Connecticut, Environmental Health and Safety (n.d.). What's That Stuff in the Stream? UConn. link
U.S. Environmental Protection Agency (1997). Volunteer Stream Monitoring: A Methods Manual (EPA 841-B-97-003), section 2.2, Designing the Stream Study. US EPA archive. link
U.S. Environmental Protection Agency (1997). Volunteer Stream Monitoring: A Methods Manual, section 2.3, Safety Considerations. US EPA archive. link
U.S. Environmental Protection Agency (1997). Volunteer Stream Monitoring: A Methods Manual, section 3.1, How to Conduct a Watershed Survey. US EPA archive. link
U.S. Environmental Protection Agency (1997). Volunteer Stream Monitoring: A Methods Manual, section 5.2, Dissolved Oxygen and Biochemical Oxygen Demand. US EPA archive. link
U.S. Environmental Protection Agency (1997). Volunteer Stream Monitoring: A Methods Manual, section 5.4, pH. US EPA archive. link
U.S. Environmental Protection Agency (1997). Volunteer Stream Monitoring: A Methods Manual, section 5.9, Conductivity. US EPA archive. link
National Water Quality Monitoring Council, U.S. Geological Survey and U.S. Environmental Protection Agency (n.d.). Water Quality Portal. link